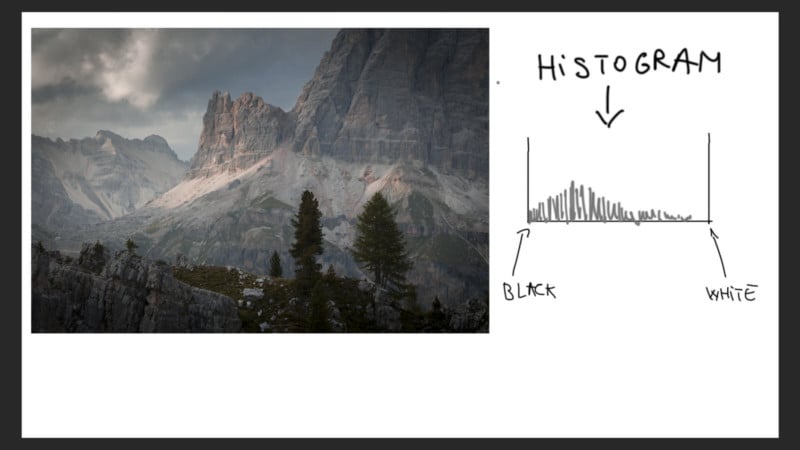
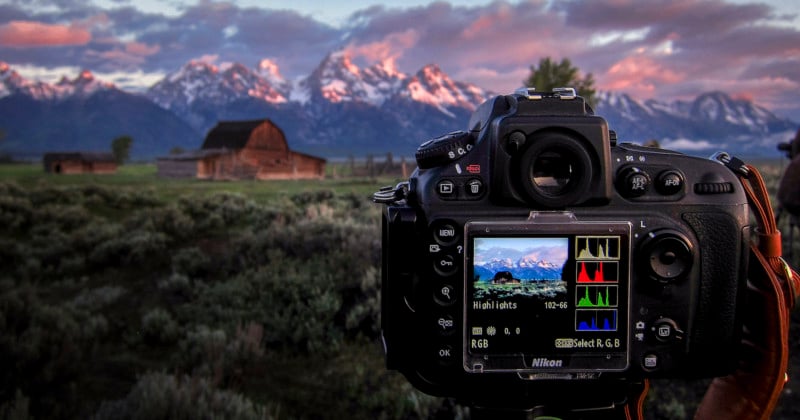
If you've spent any time playing around with the display on your digital camera's rear screen, you've most likely seen what resembles a (sometimes multicolored) line graph. You'll likely have seen something similar when editing your images in Capture One or Lightroom as well.
This graph is called a histogram. Although it may look like something you had to learn in statistics class, histograms are actually very useful for photographers. While most human eyes can detect a dynamic range of roughly 20 stops, the most advanced cameras commercially available today top out at around 15. This is where the histogram comes in handy. It provides a readout of where your highlights, mid-tones, shadows, and the various color channels fall in relation to your camera's exposure settings. If you've ever wondered why an image looks fine on the back of your camera but looks over- or underexposed when you import them into your raw editor, this infographic is for you. Understanding how to read a histogram will ensure that that your images are properly exposed, and that you're recording the maximum amount of available light information into your raw files. . thephoblographer.com
2020-7-24 07:00